Twenty trends in LGBTIQA+ weddings in Melbourne
As a gay marriage celebrant located in Melbourne, Australia, I’ve now conducted more than 200 LGBTIQA+ marriages, arguably more than any other celebrant in Australia.
In the time since marriage equality became law on 9 December 2017, there have been some trends showing up in the queer couples I’ve married, compared with my straight couples. Here are twelve of those trends.
LGBTIQA+ couples who got married were slightly older than their straight counterparts (Figure 1)

The average age of ‘brides’ in LGBTIQA+ couples is 38.4 years, compared with 38.0 years for brides in straight marriages. The average age of ‘grooms’ in LGBTIQA+ couples is 44.5 years, compared with 42.0 years for grooms in straight marriages.
In straight marriages, grooms are, on average, 4.0 years older than their brides. In LGBTIQA+ couples, the difference is slightly larger, with grooms on average 6.1 years older than brides.
The highest average age is among those using the title ‘partner’ in LGBTIQA+ couples, at 45.7 years. This category is not present among straight couples.
Overall, LGBTIQA+ couples tend to be slightly older at the time of marriage compared with straight couples. This likely reflects the more recent legalisation of marriage equality in Australia in 2017, meaning many couples who had been together for longer periods were able to marry later in life.
Interested to contribute to my blog?
The age gap between parties in LGBTIQA+ couples is higher and more evenly distributed than between parties in straight couples (Figure 2)

There is a larger age gap between LGBTIQA+ couples than straight couples, with an average gap of 7.2 years compared with 5.6 years for straight couples. The median gap is also higher (5 years for LGBTIQA+ couples versus 3 years for straight couples), indicating that this difference is consistent across the dataset, not just driven by outliers.
Looking at larger age differences, just over half of LGBTIQA+ couples (around 51%) have an age gap of more than 4 years, compared with approximately 37% of straight couples. This suggests that wider age gaps are both more common and more typical among LGBTIQA+ couples.
While there is limited formal research explaining this pattern, the data points to more variability in age pairing among LGBTIQA+ couples. Social and cultural factors may play a role, including different relationship pathways and timelines compared with straight couples.
It may also reflect the dynamics of partner selection. LGBTIQA+ individuals often navigate smaller or more dispersed dating pools, which can lead to a broader range of age pairings. As a result, compatibility may be prioritised across a wider age range, contributing to the more even and extended distribution of age gaps seen in the data.
Overall, the data shows that age differences are not only larger on average among LGBTIQA+ couples, but also more widely distributed.
The distribution of the ages of LGBTIQA+ couples is markedly wider (Figure 3)

The age distribution of LGBTIQA+ couples is more evenly spread across a broad range (approximately 25 to 70), whereas straight couples are more concentrated within a narrower age band, primarily between 26 and 44.
While straight couples tend to cluster around typical “marrying ages,” LGBTIQA+ couples show a more uniform distribution, with people marrying at a wider variety of life stages—including later in life.
This pattern may reflect differing social expectations. Straight couples are often influenced by more traditional timelines around marriage and family formation, which can lead to a concentration in certain age ranges.
In contrast, LGBTIQA+ couples may follow more varied life paths, with fewer uniform expectations around when to marry—resulting in a broader spread of ages at marriage.
87% of my LGBTIQA+ clients had never been married before (Figure 4)

A large majority of LGBTIQA+ clients (87.9%) had never been married prior to their wedding, compared with 77.6% of straight clients. This indicates that first marriages are more common among LGBTIQA+ couples in this dataset.
A smaller proportion of LGBTIQA+ clients had previously been married and divorced (11.9%), compared with a higher proportion among straight clients (21.0%). This suggests that second marriages are more common among straight couples than among LGBTIQA+ couples.
Very few LGBTIQA+ clients were widowed (0.2%), making this category negligible in comparison to the other groups.
Overall, the data shows that LGBTIQA+ couples are more likely to be entering marriage for the first time, whereas straight couples have a higher representation of individuals who have previously been married
Male Vs Female Wedding Celebrant. Who is better?
LGBTIQA+ couples are just as likely as straight couples to have lived together before marriage (Figure 5)

LGBTIQA+ couples are just as likely as straight couples to have lived together before marriage, with both groups sitting at just over 80% (approximately 83–84%). This suggests that, regardless of couple type, living together prior to marriage is now the norm rather than the exception.
For many LGBTIQA+ couples, however, cohabitation has historically carried additional meaning. Particularly in earlier years—and still today in some contexts—home has often functioned as a place of safety and authenticity in a world that has not always been accepting. Living together has sometimes meant navigating visibility carefully, with couples presenting as ‘friends’ or ‘housemates’ to others while maintaining a committed relationship privately.
This is also relevant for LGBTIQA+ people from countries where being openly queer remains unsafe or criminalised. In these contexts, living together can be both a practical and protective arrangement.
Overall, while the data shows similar rates of cohabitation across all couples, the lived experience behind those numbers can be quite different for LGBTIQA+ couples—shaped by both historical and ongoing social contexts.
LGBTIQA+ couples like their weddings in the hotter months (Figure 6)

LGBTIQA+ couples are slightly more likely than straight couples to hold their weddings in the earlier months of the year, particularly from January through to April. March appears to be the most popular month for both LGBTIQA+ and straight couples.
For straight couples, there is also a noticeable second peak later in the year, particularly in November and December, which is less pronounced among LGBTIQA+ couples.
Across the mid-year months (May to August), both groups show a dip in weddings, although LGBTIQA+ weddings remain relatively more evenly distributed throughout the year compared with straight weddings.
Overall, while both groups share similar seasonal preferences, LGBTIQA+ couples show a slightly more balanced spread across the calendar, whereas straight couples display more pronounced peaks at specific times of the year.
Most LGBTIQA+ couples opt for a Short and Sweet (legals-only) ceremony package – the opposite of straight couples (Figure 7)

Among straight couples, the majority choose either the “Legals Only Wedding” package (49.7%) or the “Superior Wedding” package (41.4%), with “Micro weddings” making up a much smaller share (9.0%). This indicates a fairly even split between couples seeking a simple, legal ceremony and those opting for a more traditional, full-service experience.
For LGBTIQA+ couples, there is a much stronger preference for the “Short & Sweet Wedding” package, which accounts for approximately 74% of all weddings. The “Big Gay Wedding” package represents a smaller proportion (19.2%), while the “Not so big gay wedding” package is used least frequently (6.8%).
Overall, LGBTIQA+ couples show a clear preference for shorter, simpler ceremonies, whereas straight couples are more evenly divided between minimal and more elaborate wedding formats.
These patterns may reflect different relationship journeys and priorities. For some LGBTIQA+ couples—particularly those who were previously unable to legally marry or who are travelling from overseas—the focus may be on formalising the relationship in a meaningful but streamlined way. In contrast, straight couples appear more likely to either follow traditional ceremony structures or opt for purely legal proceedings, resulting in a more balanced distribution across package types.
LGBTIQA+ couples are coming from foreign countries to get married (Figure 8)

Just over half (52.9%) of all wedding parties were born in Australia, with the remaining 47.1% born overseas. This indicates a highly international client base.
Among those born outside Australia, there is a wide spread of countries represented rather than a concentration in any single location. The largest overseas groups include the Philippines (7.7%), Singapore (3.6%), Malaysia (3.2%), India (2.7%), China (2.1%), New Zealand (1.9%), Vietnam (1.8%), and smaller proportions from countries such as the USA and England (both 1.6%).
Overall, while Australia remains the single largest country of origin, nearly half of all wedding parties come from overseas, highlighting the diversity of clients and the global reach of the service.
There is greater diversity in the country of birth for LGBTIQA+ couples than for straight couples (Figure 9)

Among straight wedding parties born outside Australia, there is a broad and diverse spread of countries of origin, with no single country overwhelmingly dominant, although some countries are more prominent than others.
India represents the largest group (14.2%), followed by the Philippines (7.5%) and New Zealand (5.7%). Other notable countries include England (4.7%) and the UK (4.7%), with smaller but consistent representation from countries such as Ireland, China, Lebanon, Turkey, Colombia, South Africa, Iran, and others (generally around 2–3% each).
Overall, the distribution reflects a mix of Asia-Pacific, European, Middle Eastern, African, and South American origins, indicating a highly international and multicultural client base.
Several factors likely contribute to these patterns. Migration trends play a key role, with countries such as India, the Philippines, and the UK representing some of Australia’s largest migrant communities. This increases the likelihood that individuals born in these countries are now living in Australia and choosing to marry locally.
Geographic proximity also appears relevant, particularly for countries in the Asia-Pacific region such as New Zealand and the Philippines, where travel to Australia is relatively accessible.
In addition, cultural and historical ties—especially with countries like the UK and Ireland—may contribute to Australia being a natural or familiar place to marry, whether for residents or those combining travel with significant life events.
The wide distribution across many countries suggests that straight couples in this dataset are not concentrated in just a few international markets, but rather reflect Australia’s broader multicultural population and migration patterns.
")
Among LGBTIQA+ wedding parties born outside Australia, there is a highly diverse spread of countries of origin, with no single country dominating the cohort.
The largest group is from the Philippines (20.2%), followed by Singapore (9.7%) and Malaysia (9.2%). Other notable countries include China (5.0%), Vietnam (5.0%), the USA (4.2%), Hong Kong (3.8%), Indonesia (3.4%), New Zealand (3.4%), and England (2.9%), with many additional countries contributing smaller proportions.
Overall, the data shows a strong concentration of clients from Asia and the Asia-Pacific region, alongside smaller but meaningful representation from Europe, North America, and Africa.
Several factors likely contribute to these patterns. Geographic proximity and relatively accessible travel routes make Australia an attractive destination for couples from Southeast Asia and nearby regions. In addition, established migration pathways and diaspora communities may increase awareness of Australia as a place to marry.
Legal and social factors may also play a role. Australia’s recognition of same-sex marriage, combined with its reputation as a safe and inclusive environment, may make it a preferred destination for LGBTIQA+ couples from countries where legal recognition or social acceptance is limited.
The particularly high proportion of couples from countries such as the Philippines, Singapore, and Malaysia may reflect a combination of cultural ties, travel accessibility, and differing legal or social environments in those countries.
Overall, the data highlights both the international reach of the service and the role of Australia as a destination for LGBTIQA+ couples seeking a legally recognised and supportive environment in which to marry.
Find out how to plan your wedding under $1000
The wedding term most commonly used by LGBTIQA+ couples is ‘partner’ (Figure 10)

Among LGBTIQA+ couples, the term “partner” is the most frequently used, accounting for the largest share (217 individuals), followed by “groom” (116) and “bride” (105). This indicates a clear preference for more gender-neutral terminology within LGBTIQA+ weddings, although a substantial number of individuals still choose traditional titles.
In contrast, straight couples overwhelmingly use the traditional terms “bride” (142) and “groom” (143) in almost equal numbers, with the term “partner” used only rarely (5). This highlights a strong alignment with conventional wedding terminology among straight couples.
The data suggests that LGBTIQA+ couples are more diverse in their choice of wedding titles, with a significant shift toward gender-neutral language. At the same time, the continued use of “bride” and “groom” within this group reflects a range of preferences and identities, rather than a single dominant approach.
Overall, while straight couples adhere almost exclusively to traditional titles, LGBTIQA+ couples demonstrate a broader and more varied use of language when defining their roles within a marriage.
Most LGBTIQA+ couples are drawn to non-traditional wedding venues (Figure 11)

Among straight couples, wedding venues are relatively evenly distributed across types.
Around one-third (33.1%) chose traditional wedding venues, 40.0% opted for alternative venues, and 26.9% were married at a residence. This suggests that while traditional venues remain significant, the majority of straight couples (around two-thirds) are now choosing non-traditional settings.
For LGBTIQA+ couples, the pattern is notably different. Only 16.4% chose traditional wedding venues—approximately half the proportion of straight couples—indicating a much lower reliance on conventional wedding settings.
Instead, LGBTIQA+ couples are far more likely to choose non-traditional venues. Nearly half (46.6%) were married at a residence, and a further 37.0% selected alternative venues such as outdoor locations, hospitality venues, or other non-traditional spaces.
In total, approximately 84% of LGBTIQA+ weddings took place outside traditional venues.
While both groups show a shift away from traditional venues, this trend is much more pronounced among LGBTIQA+ couples, who strongly favour more personal or flexible settings.
Overall, the data highlights a clear difference in venue preferences: straight couples maintain a more balanced mix across venue types, whereas LGBTIQA+ couples overwhelmingly choose non-traditional environments, particularly residential settings.
Number of couples who asked me to provide their two legal witnesses (Figure 12)

A significantly higher number of LGBTIQA+ couples (24) asked me to provide their two legal witnesses, compared with just one straight couple. This indicates that the need for witness provision is far more common among LGBTIQA+ clients in this dataset.
This likely reflects practical circumstances rather than preference alone. Many LGBTIQA+ couples—particularly those travelling to Melbourne to marry—may not have local friends or family available to act as witnesses, making this an important service.
In contrast, straight couples almost always provide their own witnesses, with only a single instance where this was requested.
Overall, the data highlights a clear difference in logistical needs, with LGBTIQA+ couples more likely to rely on celebrant-provided witnesses as part of their wedding arrangements.
Seasonal and Package Preference Trends Across Straight and LGBTIQA+ Wedding Couples (Figure 13)

Wedding package preferences vary by both season and couple type, with distinct patterns emerging across the year.
For straight couples, the “Superior Wedding” package shows strong peaks in March and again toward the end of the year (October to December), aligning with overall seasonal popularity. “Legals Only” weddings are more evenly distributed throughout the year, with moderate peaks in February–April and again in the later months, while “Micro weddings” remain consistently low across all months.
For LGBTIQA+ couples, the “Short & Sweet Wedding” package is the most popular across the entire year, with consistently higher volumes than other package types in every month. There are notable peaks early in the year (January–March) and again toward November and December.
The “Big Gay Wedding” package shows comparatively lower and more variable uptake, with some concentration in the earlier months of the year, particularly around March.
The “Not so big gay wedding” package remains the least utilised option and is consistently low across all months.
Overall, LGBTIQA+ couples demonstrate a strong preference for simpler, shorter-format ceremonies throughout the year, while straight couples show more seasonal variation and a stronger uptake of higher-tier packages during peak wedding months.
Find out how to plan your wedding under $1000
Evolving Wedding Package Trends: Diverging Preferences Between Straight and LGBTIQA+ Couples Over Time (Figure 14)

Wedding package preferences have shifted over time, with different trends emerging for straight and LGBTIQA+ couples.
For straight couples, the “Superior Wedding” package was highly popular in the earlier years (2016–2018), peaking during that period before declining sharply around 2019–2020. In more recent years, there has been a noticeable shift toward “Legals Only” weddings, which increased significantly from 2021 onwards and became the most common option through to 2024–2025. “Micro weddings” remain a consistently small proportion across all years, with only occasional minor increases.
For LGBTIQA+ couples, the “Short & Sweet Wedding” package is consistently the most popular option across all years. It shows a dip around 2020, followed by a strong peak around 2022–2023, before tapering off again more recently.
The “Big Gay Wedding” package appears at lower but steady levels, with some early uptake around 2018–2019 and smaller fluctuations thereafter. The “Not so big gay wedding” package remains the least used option throughout the period, with only brief increases around 2021–2022.
Overall, the data shows a clear divergence in trends: straight couples have shifted over time from more elaborate ceremonies toward simpler, legal-only options, while LGBTIQA+ couples have consistently preferred shorter, streamlined ceremonies, with less variation across the years.
Balanced Representation of Straight and LGBTIQA+ Couples in Wedding Distribution (Figure 15)

The distribution of wedding couples shows a relatively balanced mix across different couple types, with straight couples representing the largest group (142), followed by gay couples (120) and lesbian couples (86).
While straight couples make up the single largest category, LGBTIQA+ couples (gay and lesbian combined) account for the majority overall, indicating that a significant proportion of weddings officiated are within the LGBTIQA+ community.
The difference between categories is present but not extreme, suggesting a broadly diverse client base rather than a dominance of any one group.
Overall, the data reflects a strong representation of both straight and LGBTIQA+ couples, highlighting a relatively even spread across couple types.
Age Distribution Patterns in Straight Couples by Marital Status (Figure 16)

The age distribution of straight wedding couples varies noticeably depending on marital status.
For individuals who are divorced, ages are spread broadly across a wide range—from the late 20s through to the 70s—with no strong clustering in any single age group. This indicates that remarriage among divorced individuals occurs at many different life stages.
In contrast, individuals who have never been validly married show a more concentrated age distribution. Most are clustered between their late 20s and early 40s, with fewer individuals at older ages. This suggests that first marriages are more likely to occur within a narrower and earlier life stage.
Overall, the data shows that divorced individuals tend to have a more evenly distributed age profile, while those entering their first marriage are more tightly grouped within a typical age range for initial marriage.
Age Distribution Trends in LGBTIQA+ Couples by Marital Status (Figure 17)

The age distribution of LGBTIQA+ wedding couples varies by marital status, showing distinct patterns between those who are divorced and those who have never been married.
For LGBTIQA+ individuals who are divorced, ages are spread broadly across a wide range—from approximately the mid-30s through to the 70s. There is no strong clustering, indicating that remarriage occurs at many different life stages within this group.
In contrast, those who have never been validly married show a more concentrated distribution. Most individuals fall between their late 20s and mid-50s, with a noticeable clustering around the 30s to early 40s. While there are some older individuals, they are less frequent compared with the divorced group.
Overall, the data shows that, similar to straight couples, divorced LGBTIQA+ individuals have a more evenly distributed age profile, whereas first-time marriages are more concentrated within a narrower age range.
Find out how to plan your wedding under $1000
Higher Average Marriage Age Among LGBTIQA+ Couples Across Marital Statuses (Figure 18)
")
Average age varies by marital status for both straight and LGBTIQA+ couples, with LGBTIQA+ individuals consistently older across comparable categories.
Among those who are divorced, the average age is 54 for LGBTIQA+ individuals compared with 50 for straight individuals. A similar pattern appears among those who have never been validly married, with averages of 42 for LGBTIQA+ individuals and 37 for straight individuals.
For widowed individuals, the average age among straight couples is significantly higher at 76. Comparable data is not available for LGBTIQA+ couples in this category.
Overall, the data indicates that, across marital statuses where comparisons can be made, LGBTIQA+ individuals tend to marry at older ages than their straight counterparts.
Global Diversity in Wedding Parties Born Outside Australia (Figure 19)
")
Among wedding parties born outside Australia, there is a highly diverse distribution of countries of origin, with no single country dominating the cohort.
The largest group is from the Philippines (16.3%), followed by Singapore (7.6%) and Malaysia (6.7%). Other notable countries include India (5.8%), China (4.4%), New Zealand (4.1%), Vietnam (3.8%), England (3.5%), and the USA (3.5%), with many additional countries contributing smaller proportions.
Overall, the data shows a strong representation from Asia-Pacific countries, alongside a meaningful presence from Europe and North America. This indicates that the client base is both regionally and globally diverse.
Several factors may help explain these patterns. Geographic proximity and travel accessibility likely contribute to the higher representation from Asia-Pacific countries such as the Philippines, Singapore, Malaysia, and India. Established migration pathways and diaspora communities in Australia may also play a role, making Australia a familiar and accessible destination.
In addition, Australia’s legal framework and reputation as a safe and inclusive destination may make it an attractive place for couples—particularly those from countries where marriage laws or social acceptance differ—to formalise their relationships.
The wide spread across many countries also suggests that couples are not coming from just a few specific regions, but rather that there is broad international reach, with individuals from many different cultural backgrounds choosing to marry in Australia.
High International Representation Among LGBTIQA+ Wedding Parties (Figure 20)

Among LGBTIQA+ wedding parties, Australia remains the single largest country of birth (45.8%), although this is notably lower than when looking at all couples combined, indicating a more internationally diverse cohort.
A substantial proportion (54.2%) of LGBTIQA+ clients were born outside Australia, with the largest overseas groups including the Philippines (10.9%), Singapore (5.2%), Malaysia (5.0%), China (2.7%), Vietnam (2.7%), the USA (2.3%), Hong Kong (2.1%), and smaller proportions from countries such as Indonesia, New Zealand, England, Ireland, and South Africa.
Overall, the data shows a strong representation from Asia-Pacific countries, alongside a spread of clients from Europe, North America, and Africa. No single overseas country dominates, suggesting a broad and diverse international client base.
This pattern may reflect a combination of factors, including Australia’s reputation as a safe and inclusive destination for LGBTIQA+ couples, as well as its accessibility from nearby regions. Established migration pathways and diaspora communities may also contribute to couples choosing Australia as a place to marry.
The relatively high proportion of overseas-born LGBTIQA+ clients highlights the global reach of the service and suggests that, for many couples, Australia serves not only as a wedding destination but also as a place where they can formalise their relationship in a supportive legal and social environment.
11 Surprising destinations to avoid for same-sex honeymoons
There are more than 70 countries where same-sex relations are illegal and, in 8 of those, same sex relations are punishable by death. Find out which countries you should avoid for your same-sex honeymoon.
38 Same-Sex Wedding Rituals & Traditions
Know about 38 wedding rituals and traditions that have become part of straight weddings over the centuries and how their alternatives are reinventing the LGBTIQ+ weddings in a authentic way!
4 Much Needed Changes In The Notice of Intended Marriage (NOIM)
There is a need for changes in the NOIM. The challenges that every marriage celebrant and couples face can be avoided if these changes are implemented.
4 Wedding & Engagement Ring Alternative Trends In 2021
Are you getting married but are looking for a ring that’s outside the box? Nowadays people are less bound by traditional ideas of seeking out a ring that fits into the wedding or engagement ring category, but rather a piece that suits their personality. Read more.
7 Things You Must Know Before Attending a Same-Sex Wedding
Find out 13 gift ideas in this blog for a same sex wedding. Gifts range from pet care, wedding photography, a painting perhaps or just cook for the couple.
8 Statistical Facts About Same Sex-Marriage & Couples in Australia
Australia is the 25th country in the world where marriage equality and same-sex marriage became a legal right. Same-sex marriage became law in Australia on 9 December 2017.
All you need to know about IDAHOBIT
Each year, on 17 May, the LGBTIQ+ community around the world celebrates the International Day Against Homophobia Biphobia Interphobia and Transphobia – IDAHOBIT. Learn all you need to know about this day.
All you need to know about Marriage Equality in Australia
Find out what has changed since 9 Dec 2017 when the Australian Federal Government passed the Marriage Amendment Act 2017 and the journey so far.
Commitment Ceremony vs Legal Marriage in Australia (LGBTQ+ Guide)
What’s the difference between a commitment ceremony and legal marriage in Australia? Here’s a clear LGBTQ+ guide to help you choose what’s right for you.
Community Support Services in Melbourne
This blog has a list of LGBT community support services that are being offered by committed institutions and bodies in Melbourne. There is much that can be done, and together we can help each other lead a better life.

Eight Months Prior To Your Wedding Day
Eight months to wedding day. There is a little less to do than others. This is one of those months. Setting up dates and budgeting for the wedding is on the list.
Eleven Months Prior To Your Wedding Day
Eleven months to wedding day its important that you start working on your celebrant, photographer, videographer, other AV providers, and music.
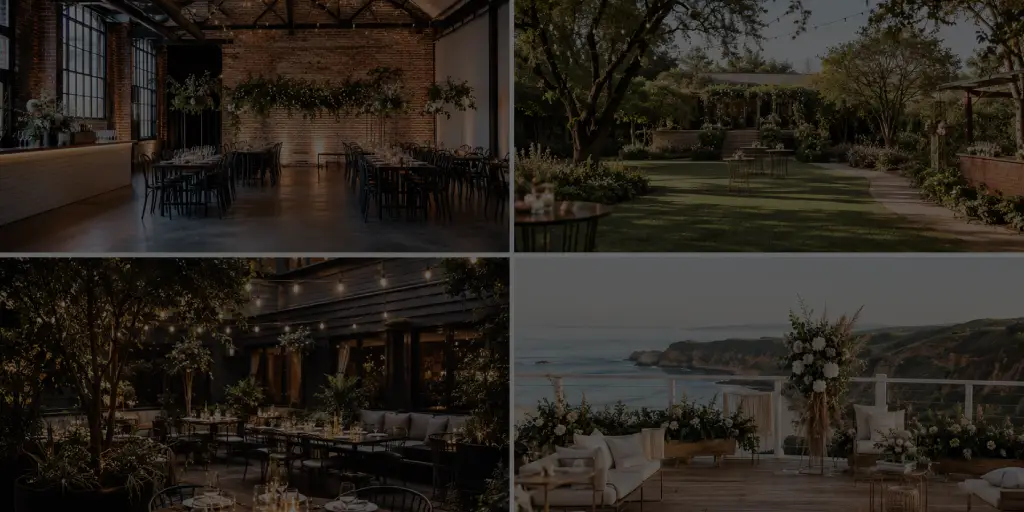
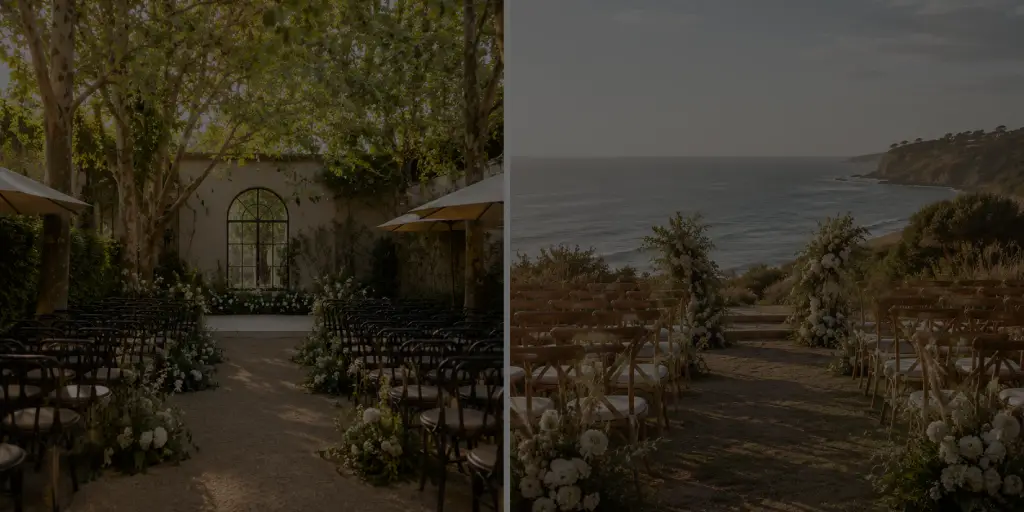
Emerging Gay-friendly Wedding Venues in Melbourne
Discover inclusive, flexible LGBTIQ+ wedding venues in Melbourne—from rooftop bars to gardens—perfect for smaller, more personal celebrations shaped by you.
FAQs on Foreign LGBTIQA+ Couples getting Married in Australia
Wondering how gay weddings work in Australia? The legal process is exactly the same — no extra paperwork, just your Notice of Intended Marriage, two witnesses, and an authorised celebrant. The best part? You have complete freedom to create a ceremony in Melbourne that’s authentic, inclusive, and unapologetically you.
Five Months Prior To Your Wedding Day
Five months to wedding day so it is important that you start working with your photographer, the decorator to ensure that everthing is on track.
Follow-up after your Wedding
The Day to wedding day so it is important that you start working with your photographer, the decorator to ensure that everthing is on track.
Four Months Prior To Your Wedding Day
Four months to wedding day so it is important that you start working with your photographer, the decorator to ensure that everthing is on track.
Four weeks Prior To Your Wedding Day
Four weeks to wedding day so it is important that you start working with your photographer, the decorator to ensure that everthing is on track.
Fun Ideas for Your Vow Renewal in Melbourne
If you are a same-sex couple, your ceremony can be similar to any other wedding vow renewal in Melbourne. Creative vow renewal ideas can light up your ceremony. Beachside ceremonies, a garden setting or some important place that connects both of you - a unique idea can make it special.

Gay Celebrant Melbourne: What to look for (and what to avoid)
Looking for a gay celebrant in Melbourne? Choose someone who goes beyond “inclusive” language to create a ceremony that feels natural, modern, and completely true to your relationship.
Gay Wedding Celebrant Daylesford | LGBTQ+ Celebrant Daylesford VIC
Inclusive gay wedding celebrant in Daylesford, VIC creating relaxed, personalised LGBTQ+ ceremonies that feel natural, meaningful, and true to you.
Gay Wedding Celebrant in Fitzroy
What’s the difference between a commitment ceremony and legal marriage in Australia? Here’s a clear LGBTQ+ guide to help you choose what’s right for you.
Gay Wedding Celebrant Melbourne CBD
Looking for a gay wedding celebrant in Melbourne CBD? Inclusive, personalised LGBTQ+ ceremonies in the heart of Melbourne.
Gay Wedding Ceremony Ideas That Actually Feel Like You
One of the biggest advantages of planning a queer ceremony is you’re not automatically tied to “this is just how it’s done”. Which means you get to ask better, more useful questions.
Gay Wedding Ideas in Australia
Almost every couple I marry is seeking a meaningful ceremony that allows them to tell their story. They want a wedding ceremony that they can identify with and celebrates their love, in a way like no one else they know has done.
Gay Wedding Venues Melbourne: Inclusive Spaces That Actually Feel Good to Be In
What options are available in and around Melbourne for organizing an inclusive and meaningful gay wedding ceremony
Getting Married in Australia on a Tourist Visa (LGBTQ+ Guide)
Find out how to get married in Australia on a tourist visa. This has everything you need to know.
Getting married in Australia on a visa – for same-sex couples
Easy Steps to Getting married in Australia on a visa. Can I marry in Australia on visitor visa? Legal requirements to get married in Australia.
How a Celebrant Can Customise Your Wedding Ceremony in Melbourne
By hiring a wedding celebrant in Melbourne, you will have the flexibility to design a custom wedding ceremony that suits your individual preferences and that celebrates your unique family. You can have the ceremony anywhere and anytime you want, that reflects your personal beliefs and lifestyle.
How do gay weddings work? (Yes, it’s a real question)
Wondering how gay weddings work in Australia? The legal process is exactly the same — no extra paperwork, just your Notice of Intended Marriage, two witnesses, and an authorised celebrant. The best part? You have complete freedom to create a ceremony in Melbourne that’s authentic, inclusive, and unapologetically you.
How To Get Married in Australia – For LGBT Couples
In Australia the same law applies to straight couples and LGBT couples. Few aspects are to be remembered like Free Consent, the Marriage Act 1961 etc.
How to Get Married in Australia as an LGBTQ+ Foreigner (2026 Complete Guide)
A friendly guide for Australian and international couples — with just the right amount of sparkle.
How to Navigate Family Dynamics at a Queer Wedding
Planning a queer wedding? Learn how to navigate family dynamics, honour chosen family, and create a ceremony that feels authentic, calm, and truly yours.
How To Plan Your Commitment Ceremony in Melbourne
Lot of couples desire to plan a commitment ceremony instead of a marriage ceremony. Planning a same-sex commitment ceremony is really very similar to planning any other wedding ceremony in Melbourne. Find out what to Consider when Planning a Commitment Ceremony vs a Marriage Ceremony in Melbourne?
How To Plan Your Same Sex Wedding on a $1000 Budget
Same sex wedding on a budget means lot of things. With a creative approach and some romantic flair of planned events, we bet you can make your wedding a memorable one right here in Melbourne.For starters you can avoid holidays & weekends.
How to Work Respectfully With LGBTI Couples as a Wedding Supplier
As a Wedding Supplier it is vital to avoid any assumptions and know the preferences of your LGBT client. A Wedding Supplies number one rule should be to reassure a LGBTI couple that they will never compromise their status. Being discreet in any communication helps a lot. Find out more in this blog.
Ideas for Your Commitment or Marriage Ceremony in Melbourne
Four fresh marriage ceremony ideas that go beyond the traditional wedding or commitment ceremony with these unique unity ceremonies. You can choose from a Sand ceremony, Love letter ceremony, Planting a tree or Handfasting as an unity action to solidify your commitment in Melbourne. Read for more.
Impact of COVID-19 restrictions on Weddings & Funerals – JOY 94.9 Interview
The journey to become a parent is not always easy for any couple. Increasingly, it is a journey that more and more people – both couples and single people – are choosing to embark on. Read on to know about the surrogacy journey of a gay couple in Australia.
Is Same-Sex Marriage Legal in Australia? (2026 Guide for LGBTQ+ Couples)
This guide explains the legal requirements, international considerations, and what queer couples need to know when getting married in Australia.
LGBTIQA+ Parenthood Pathways in Victoria: Legal, Medical and Practical Considerations
Discover how LGBTIQA+ individuals facing persecution in their home countries can seek safety and protection in Australia. Learn about legal options, case studies, and the importance of finding a supportive legal team.
LGBTIQA+ Wedding Guide Download – Australia as a Destination For Your Wedding
Download your Free copy of Same-Sex Wedding Planner specially designed for LGBT weddings in Melbourne, Victoria. Month-by-month to-dos for couples for a unique wedding ceremony.
Migration Legal Services for LGBTIQA+ Individuals Seeking Safety in Australia
Discover how LGBTIQA+ individuals facing persecution in their home countries can seek safety and protection in Australia. Learn about legal options, case studies, and the importance of finding a supportive legal team.
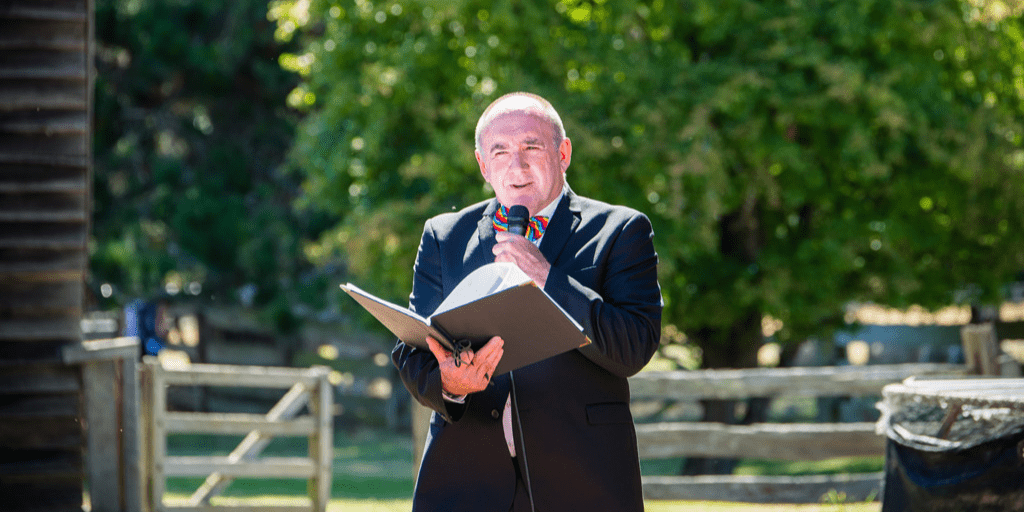
My journey towards 200 LGBTIQA+ weddings
Discover the inspiring journey of Bronte Price, a trailblazing marriage celebrant dedicated to celebrating love in all its forms. From the challenges of pre-marriage equality to performing 200+ LGBTIQA+ weddings, explore his commitment to creating authentic, inclusive ceremonies and empowering couples worldwide.
Nine Months Prior To Your Wedding Day
Nine months to wedding day so it is important that you start working with your photographer, the decorator to ensure that everthing is on track.
On Your Wedding Day – For Your Attendants
The Day to wedding day so it is important that you start working with your photographer, the decorator to ensure that everthing is on track.
One Week Prior To Your Wedding Day
One weeks to wedding day so it is important that you start working with your photographer, the decorator to ensure that everthing is on track.
Outdoor Wedding Ceremonies Melbourne: Beautiful, Inclusive, and Slightly Less Simple Than They Look
If you’re planning an outdoor ceremony and thinking “We just want something simple and relaxed”.
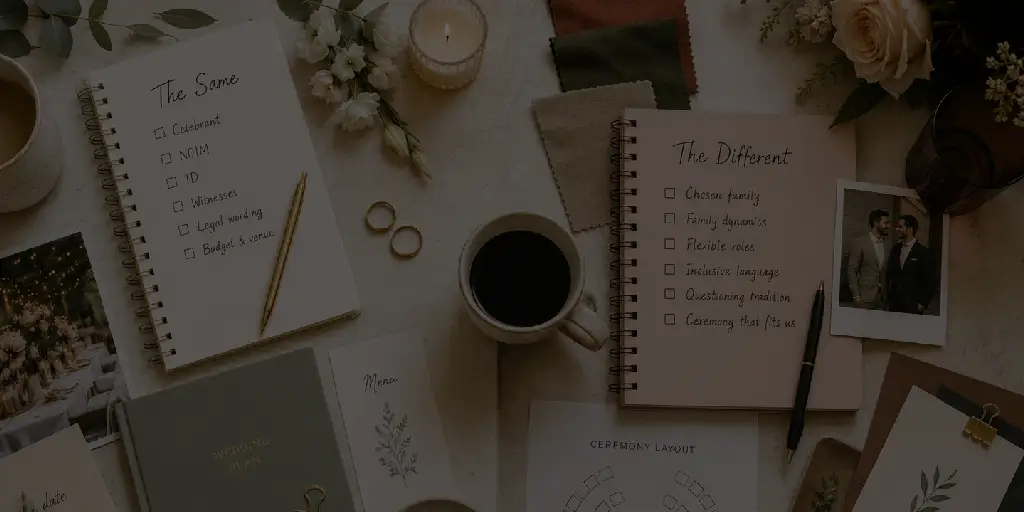
Planning a Queer Wedding in Australia: What’s Different (and What Isn’t)
A queer wedding in Australia is not a completely different category of wedding. But it often creates more room to personalize it.
Quick Facts About Same-sex Prospective Marriage Visa in Australia
The change in Australian marriage law allowing LGBT couples to get married opened up immigration opportunities that didn't previously exist. Now the Prospective Marriage Visa is now open to anyone.
Role of the Civil Marriage Celebrant
What can you expect from a Civil Marriage Celebrant during the planning and the wedding ceremony? How to get all the help you need from the celebrant for your wedding?
Same Sex Couples – Change of Name After Marriage?
Do you need to change your last name after they’ve got married as a same-sex couple? Or can you continue with your present surname? Find out the pros and cons of name change after marriage.
Same-Sex Wedding Checklist
In Australia the same law applies to straight couples and LGBT couples. Few aspects are to be remembered like Free Consent, the Marriage Act 1961 etc.
Seven Months Prior To Your Wedding Day
Seven months to wedding day. There is a little less to do than others. This is one of those months. Setting up dates and budgeting for the wedding is on the list.
Should You Choose a Male or Female Celebrant?
While choosing a marriage celebrant in Melbourne, find out who among a male or femal wedding celebrant can best accommodate for any significant life event. A lot of decision making goes into planning any ceremony, so you should know if the gender of the celebrant can make any difference at all.

Six Months Prior To Your Wedding Day
Six months to wedding day so it is important that you start working with your photographer, the decorator to ensure that everthing is on track.
Special Wedding Dates for LGBTI Couples in 2019
Lots of LGBTI couples want special dates for their special day that they’ve waited far too long for their wedding. If you’re a couple trying to zero down a date, there are endless ways to decide on one.
Surrogacy: when, not if, you will be parents
The journey to become a parent is not always easy for any couple. Increasingly, it is a journey that more and more people – both couples and single people – are choosing to embark on. Read on to know about the surrogacy journey of a gay couple in Australia.
Ten Months Prior To Your Wedding Day
Ten months to wedding day its important that you start working on your wedding preparations like catering, booking venue. guest list, selecting your dates.
The Comprehensive Guide to a Queer Wedding
A queer wedding is about love without compromise. Find inspiration, ideas, & styling tips to create a celebration that’s truly yours.
The Day Before Your Wedding
The Day to wedding day so it is important that you start working with your photographer, the decorator to ensure that everthing is on track.
The Day Of Your Wedding
The Day to wedding day so it is important that you start working with your photographer, the decorator to ensure that everthing is on track.
The Role of the Civil Marriage Celebrant
Find out about the role of a Marriage celebrant in Australia. Celebrants are highly trained and qualified. Marriage Celebrants appointed since 2003 have had to undergo special training before being appointed. Read more on what to expect from a marriage celebrant.
The Ultimate Guide To Wedding Rings For LGBTIQ+ Couples
Are you engaged and are looking for a LGBTIQ+ friendly Wedding Ring that’s outside the box? Find out about Wedding Ring types, popular LGBT trends, where to shop online and more in this detailed guide.
Three Months Prior To Your Wedding Day
Three months to wedding day so it is important that you start working with your photographer, the decorator to ensure that everthing is on track.
Three weeks Prior To Your Wedding Day
Three weeks to wedding day so it is important that you start working with your photographer, the decorator to ensure that everthing is on track.
Tips for marriage celebrants to keep in mind when working with wedding photographers
Nobody is going to be looking at the happy couple, instead just wondering who the heck that face belongs to, in the background when the couple are kissing.
Top 13 Gift Ideas For a Same-Sex Wedding
Find out 13 gift ideas in this blog for a same sex wedding. Gifts range from pet care, wedding photography, a painting perhaps or just cook for the couple.
Top Wedding Dress Shopping Tips For Lesbian Brides
Choosing outfits for lesbian brides is a challenging task. Find some tips here, from experts in wedding fashion, to help you with your wedding dress.
Twelve Months Prior To Your Wedding Day
Just before a year to your wedding day its important that you need to start focusing on the big things like style, size, budget, date and guest list.
Twenty trends in LGBTIQA+ weddings in Melbourne
Almost every couple I marry is seeking a meaningful ceremony that allows them to tell their story. They want a wedding ceremony that they can identify with and celebrates their love, in a way like no one else they know has done.
Two Months Prior To Your Wedding Day
Two months to wedding day so it is important that you start working with your photographer, the decorator to ensure that everthing is on track.
Two weeks Prior To Your Wedding Day
Two weeks to wedding day so it is important that you start working with your photographer, the decorator to ensure that everthing is on track.
Ways to Plan Your Gay Wedding Ceremony in Melbourne
Plan Your Gay Wedding Ceremony in Melbourne so that everything falls in line on your special day. Just as with wedding ceremonies, there are countless ways to make your ceremony meaningful, personal, and reflective of who you are, individually and as a couple.
Welcome Your New Baby With a Naming Day Ceremony in Melbourne
Naming Day Ceremony in Melbourne are done by celebrants like Bronte Price. The important thing is to celebrate your unique family, commemorate the special commitment you are making to your child.
What’s the Legal Status of Gay Marriage in Australia?
A friendly guide for Australian and international couples — with just the right amount of sparkle.
Why Couples Renew Their Wedding Vows: Bronte Price Speaks with Tom Elliott on 3AW
Discover the growing trend of renewing wedding vows. From milestone anniversaries to heartfelt personal promises, learn why couples celebrate their love again with unique, meaningful ceremony.

Why Do Closeted Couples Get Married?
My experience with lots of closeted couples has taught me that they fear that sort of reaction – and it can even drive them further back into the closet and make them close that closet door for even longer.
Why Do Some Choose a Commitment Ceremony Over a Wedding?
Find out the key differences in Commitment Ceremony Vs Wedding Ceremony. There are numerous reasons why both heterosexual and homosexual people choose not to get married. Reasons why some choose the former over the later and more from the Gay celebrant in Melbourne.
Your Guide to Lesbian and Same-Sex Weddings in Melbourne and Victoria
Planning a unique, romantic, and budget-friendly lesbian wedding in Melbourne? Get expert tips, venue ideas, and advice from an experienced gay marriage celebrant with over 200+ LGBTIQA+ weddings under his belt. Discover how to create a meaningful ceremony tailored to your needs.
Error: No feed found.
Please go to the Instagram Feed settings page to create a feed.